Full Mathlib Spectral Analysis: Preliminary Findings from Prototype
ProofGraph treats the dependency graph of formalized mathematics as a complex network and applies spectral graph theory to study its structure. After validating the pipeline on individual Mathlib modules, we ran a full spectral analysis of the entire library. This post describes what we found.
Extraction and method
ProofGraph’s extraction tool (written in Lean 4, adapted from LeanDepViz) walks every ConstantInfo in the Lean Environment, collecting theorems, definitions, inductive types, and other declaration kinds into nodes. Edges come from constants referenced in each declaration’s type expression and definition body (via Expr.getUsedConstants), merged into a single set of depends_on edges. The full extraction yields 323,489 declarations and 7,516,850 edges, giving a mean degree of approximately 47.
For spectral analysis, we convert to an undirected graph and compute the normalized symmetric Laplacian. The key quantity is the algebraic connectivity (second-smallest Laplacian eigenvalue), which measures how tightly connected the graph is. The associated Fiedler vector induces a natural bipartition approximating the sparsest cut. We compute these using SciPy’s ARPACK-based sparse eigensolver, which handles graphs at this scale.
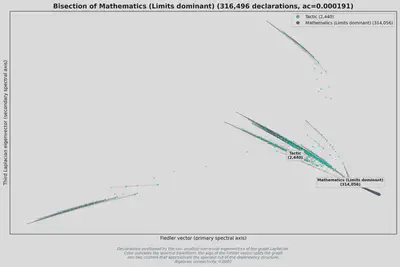
The Fiedler bipartition: tactics vs. mathematics
The largest connected component contains 316,496 declarations with an algebraic connectivity of 0.000191, indicating a very loosely connected graph. The Fiedler bipartition separates 2,440 declarations from the remaining 314,056.
The spectral method has no access to module paths, file locations, or declaration kinds. It sees only dependency structure. Yet content analysis of the smaller partition reveals it is overwhelmingly tactic and metaprogramming infrastructure: 62.5% belongs to Mathlib.Tactic namespaces, and 17.9% to Mathlib.Meta. The cluster is 68.9% definitions and 17.2% theorems, inverting the ratio of the mathematical body (76.4% theorems, 20.1% definitions).
The tactic/mathematics division cuts across Mathlib’s directory structure and emerges from dependency patterns alone. Tactics call into mathematical results but rarely the reverse, and they share metaprogramming infrastructure that mathematical content does not use. These asymmetric dependency patterns are what the spectral method detects.
Recursive bisection: peeling the onion
We applied recursive spectral bisection to the mathematical body: after each Fiedler bipartition, extract the larger partition’s induced subgraph and bisect again, continuing to depth 15.
Each bisection peels off a peripheral layer and leaves a tighter core:
| Depth | Core Size | AC / Root | What Peeled Off |
|---|---|---|---|
| 0 | 316,496 | 1x | (root) |
| 1 | 314,056 | 12x | Tactics (2,440) |
| 2 | 309,953 | 14x | Computability theory (4,103) |
| 3 | 309,634 | 25x | Residual tactics (319) |
| 4 | 308,953 | 34x | Equivalences (681) |
| 5 | 305,913 | 51x | Weak sequences (3,040) |
| 6 | 304,068 | 64x | Polynomial functors, coinductive types (1,845) |
| 7 | 300,736 | 73x | Free products, monoid coproducts (3,332) |
| 8 | 295,109 | 87x | Formal languages (5,627) |
| 9 | 294,176 | 114x | Miscellaneous periphery (933) |
| 10 | 279,003 | 126x | Lex orderings (15,173) |
| 11 | 277,653 | 148x | Relations (1,350) |
| 12 | 263,301 | 156x | Permutations (14,352) |
| 13 | 254,432 | 166x | Pseudofunctors (8,869) |
| 14 | 240,623 | 174x | Graph walks (13,809) |
| 15 | 215,326 | 186x | Graph walks (25,297) |
At depth 15, 215,326 declarations (68% of the original graph) remain in a single cluster that is 186 times more spectrally connected than the root. This core fuses algebra, analysis, geometry, category theory, and measure theory into a body that resists further spectral decomposition.
Caveats
Part of the concentric pattern is a mechanical consequence of the method: recursively removing the least-connected piece always tightens the remainder. What is not mechanical is the rate of tightening (186x over 15 levels) and the interpretability of what peels off at each stage. Whether this progression is steeper or more structured than what random graphs with similar degree distributions would produce is an open question. A null-model comparison (recursive bisection on configuration model random graphs preserving Mathlib’s degree sequence) is planned.
Each finding may reflect genuine mathematical structure, library organization choices, or formalization history. For instance, the computability cluster peeling off at depth 2 may reflect the fact that computability theory was contributed as a relatively self-contained project. The cross-library comparison with CSLib’s computability content will help distinguish these possibilities. Systematically distinguishing structure from artifact is part of the research program.
What comes next
These are spectral findings from one analytical method on one library. Future work will apply community detection, centrality analysis, and core-periphery decomposition, compare spectral communities to the Mathematics Subject Classification (MSC), run a comparison to a null-model, and extend the extraction to other Lean ecosystem libraries.
The extraction pipeline and spectral analysis code are available at github.com/paretoandsolomon/proofgraph.
Jonathan Llovet
Researcher
Applying network science and spectral graph theory to formalized mathematics.